











Mobile App Analytics: Which Metrics Should You Track?
It is easy to get lost among many metrics. We list the mobile app metrics that actually drive decisions: activation, retention, crash rate and an event plan.
Your app is live and downloads are coming in. But are users really using it, and where do they get stuck? Analytics answers these questions, but if set up wrong it only produces vanity numbers. Here is where to start.
Define your questions first
Before choosing metrics, ask "which decision do I want to make?" For example, do you want to improve the sign-up flow, or understand whether a feature is used? A metric not tied to a decision is not worth tracking.
Core metric groups
- Acquisition: which channel downloads come from and the rate from install to first open.
- Activation: the moment a user first experiences the app's value. It varies by app; in a shopping app it may be the first add-to-cart, in a booking app the first reservation.
- Retention: the share of users who come back on day 1, day 7 and day 30.
- Engagement: session frequency and use of key features.
- Revenue: the share of paying users and revenue per user.
Activation is the most important indicator
Many apps look at download counts and feel satisfied, yet the real loss happens in the first session. Measure the steps from sign-up to activation as a funnel and find the screen where you lose users. A small fix is often more effective than a big campaign.
Technical health metrics
Crash-free session rate, app launch time and network error rate directly affect the user experience. Always set up crash reporting; seeing which device and version has the problem speeds up debugging a lot. Falling store ratings usually have a technical issue behind them.
Prepare an event plan
Trying to measure everything creates noise. Instead, write a short list of events covering the important user actions.
- Use a consistent format in event names, for example "order_completed".
- Add meaningful properties to each event, such as product category or payment method.
- Document the plan; iOS and Android should use the same names.
Cohort analysis
Group users who signed up in the same week and see how they behave over time. After an update, is retention improving for new cohorts? Averages hide this difference; cohorts reveal it.
Privacy and consent
Analytics tools collect user data. For KVKK compliance, state what you collect in your privacy policy, obtain consent where required and prefer non-personal, aggregated data. Keep the stores' privacy declarations consistent with reality.
A practical tip
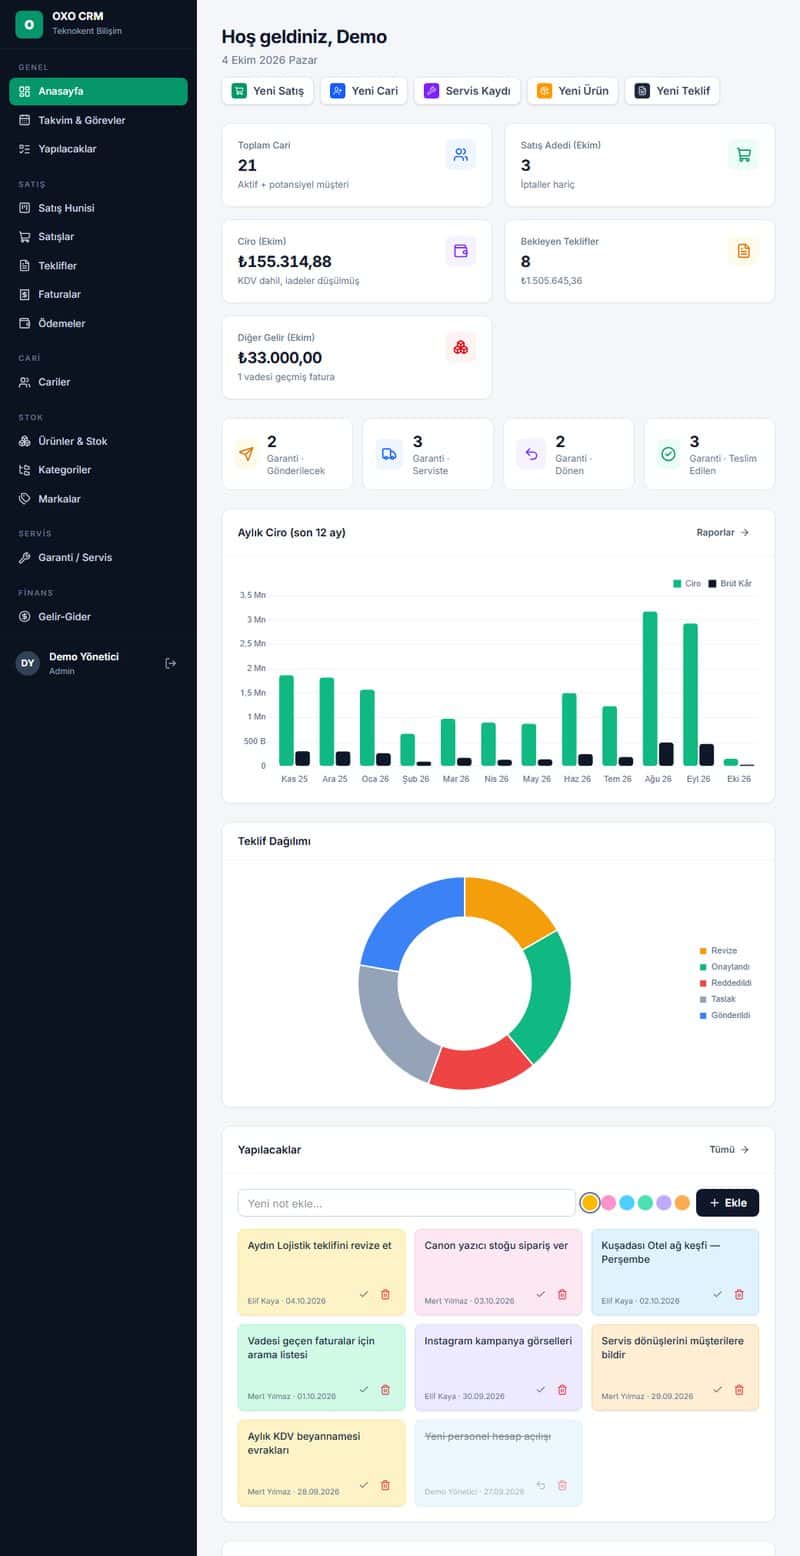
Review your numbers on a fixed schedule, for example every two weeks, and write down one decision each review produced. If a metric never leads to a decision, remove it from the dashboard.
Conclusion
A few well-chosen metrics are worth more than hundreds of dashboards. If you would like to build your measurement plan together and integrate analytics into your app, see our mobile app service or reach out.